Tableau Quick Table Calculations
Tableau is one of the most widely used data visualization tool to get insights from massive amount of data. It has many advanced features and quick table calculation is one of them. In this article, we’re gonna talk about how we can use quick table calculation to transform data into visualizations to get meaningful insights. Quick table calculations pre-built formulas work with these 2 variables.
- What dimensions you have on the view to calculate the number
- What direction you want the table calculation to go
So basically it recreates the formula based on how you are cutting up the data and what direction you want to go. Although there’s around 10 types of quick table calculation, we are going to cover the top 5 with example.
Overview
To demonstrate how these quick table calculations work, I am using some sample data from Redbox, which is a video rental company. This is the sample data which you can see below. This data contains different users doing different transactions in each day.
You can download this data along with final workbook using the link below.
to download the workbook to follow along!
Now let’s dive in top 5 quick tableau calculations. I am going to show here step by step, how each type of calculation transforms data in a table. Make sure you stick around to the end, so that you get all of the different features that can be used with quick table calculations.
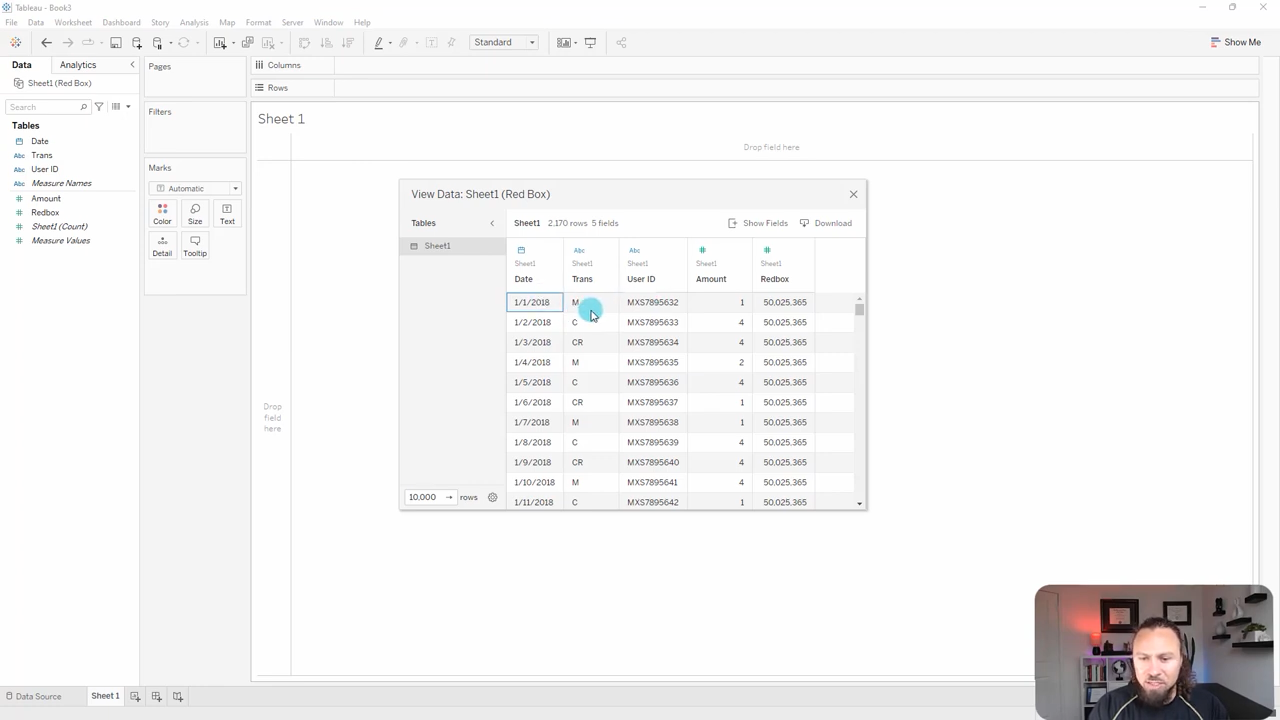
Tableau Running Quick Table Calculation
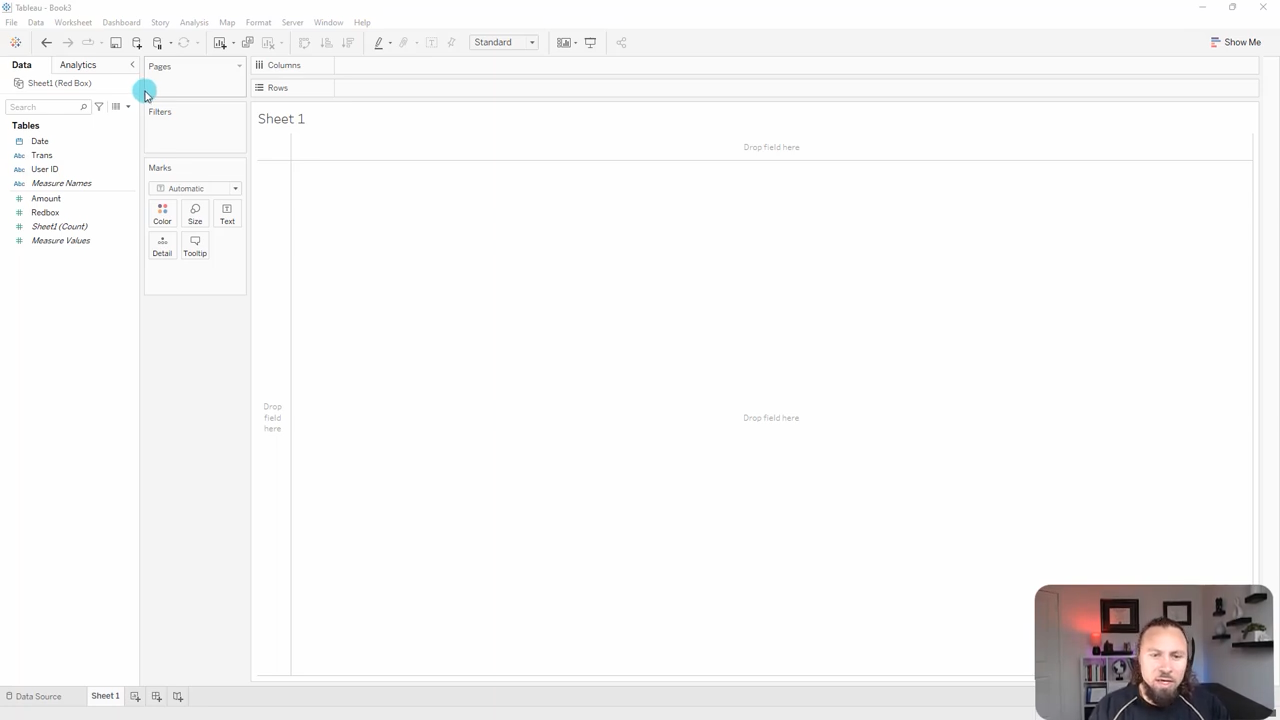
Running total calculates the cumulative total of a measure across a table. Let’s experience it with real example. First lets connect to the sample data with Tableau, after we connect this is how it looks.
Following Along
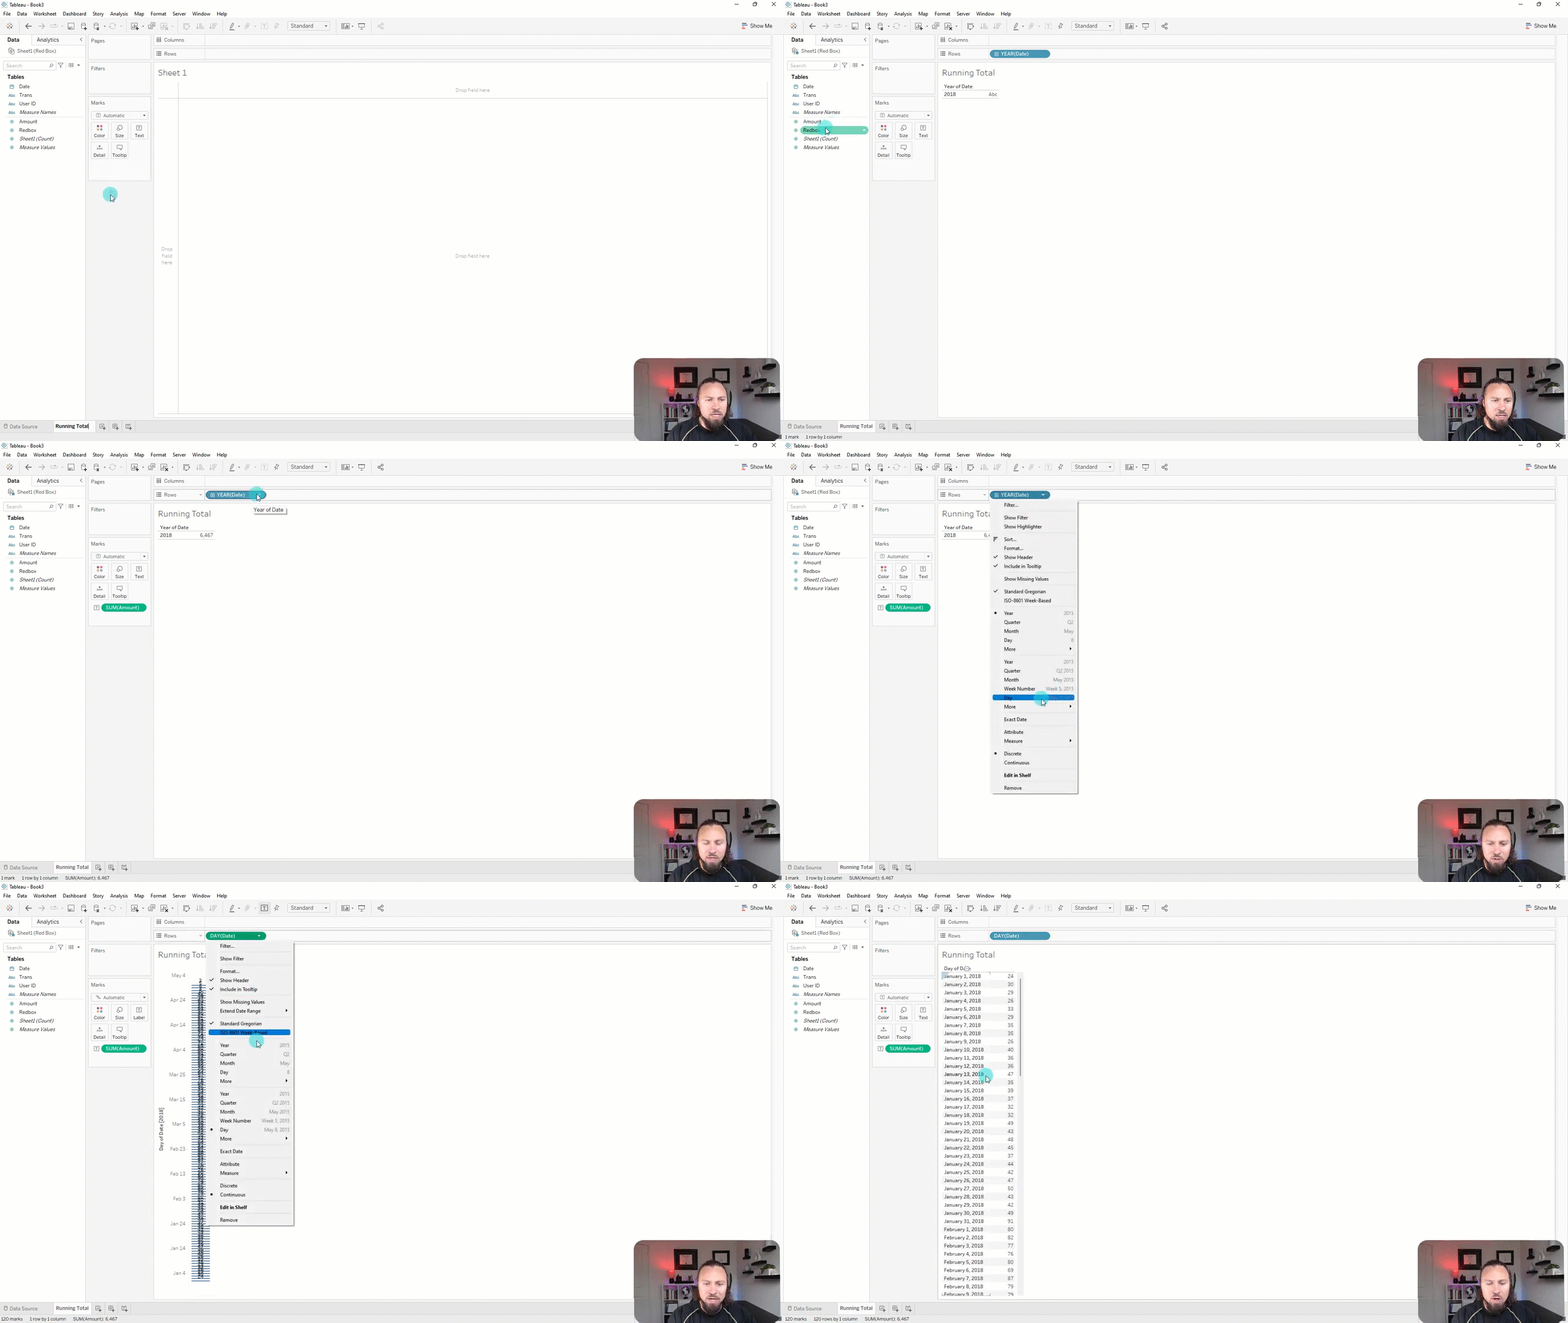
1. Drag and Drop the Date to rows shelf and make it from year to day. Make sure discrete is selected. After that bring Amount to worksheet.
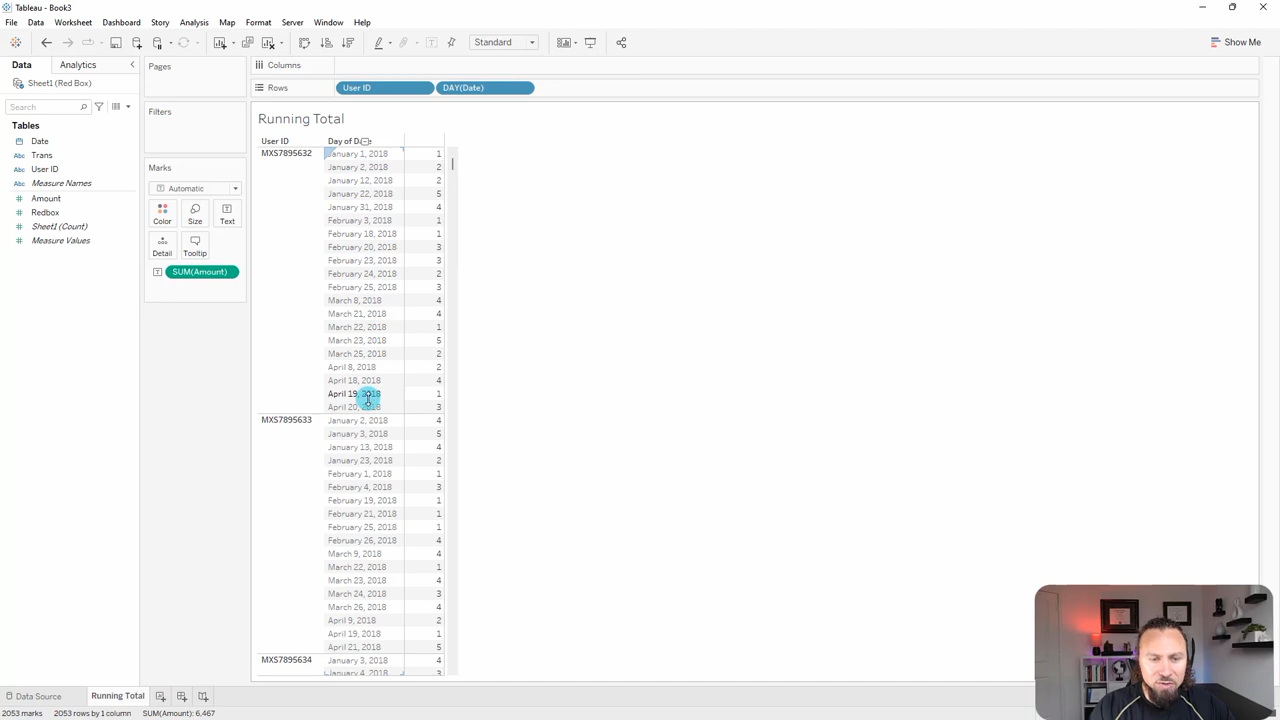
2. Now let’s bring User ID to rows shelf and keep it in front of Date. Now, we can see for each user, the dates that they made transactions.
3. Next I want to tag a user with their first transaction date. So I’m going to tag them, with their first Acquisition Date, and then I’m going to count distinct users, from there I will do a running total. This will show how the population is growing over time.
In order to tag we are going to use a LOD calculation which is a level of detail calculation. LOD is an advanced topic, which we are not going to cover in this article. If you want to know more about LOD then you can try our LOD master course. For this article, you don’t need to understand it, just follow along.
Now click on “create calculated field” and I am going to name it “Acquisition Date”. The formula I used is given below.
{ FIXED [User ID]:MIN([Date])}
This formula will look for each user ID and tag the minimum transaction date they have. Now let’s bring Acquisition Date to rows shelve and change Year to Day. Now, it’s gonna be just the first transaction date for each one. Let’s remove the Date from row shelve previously added. So now we can see how many users there are for each Acquisition Date.
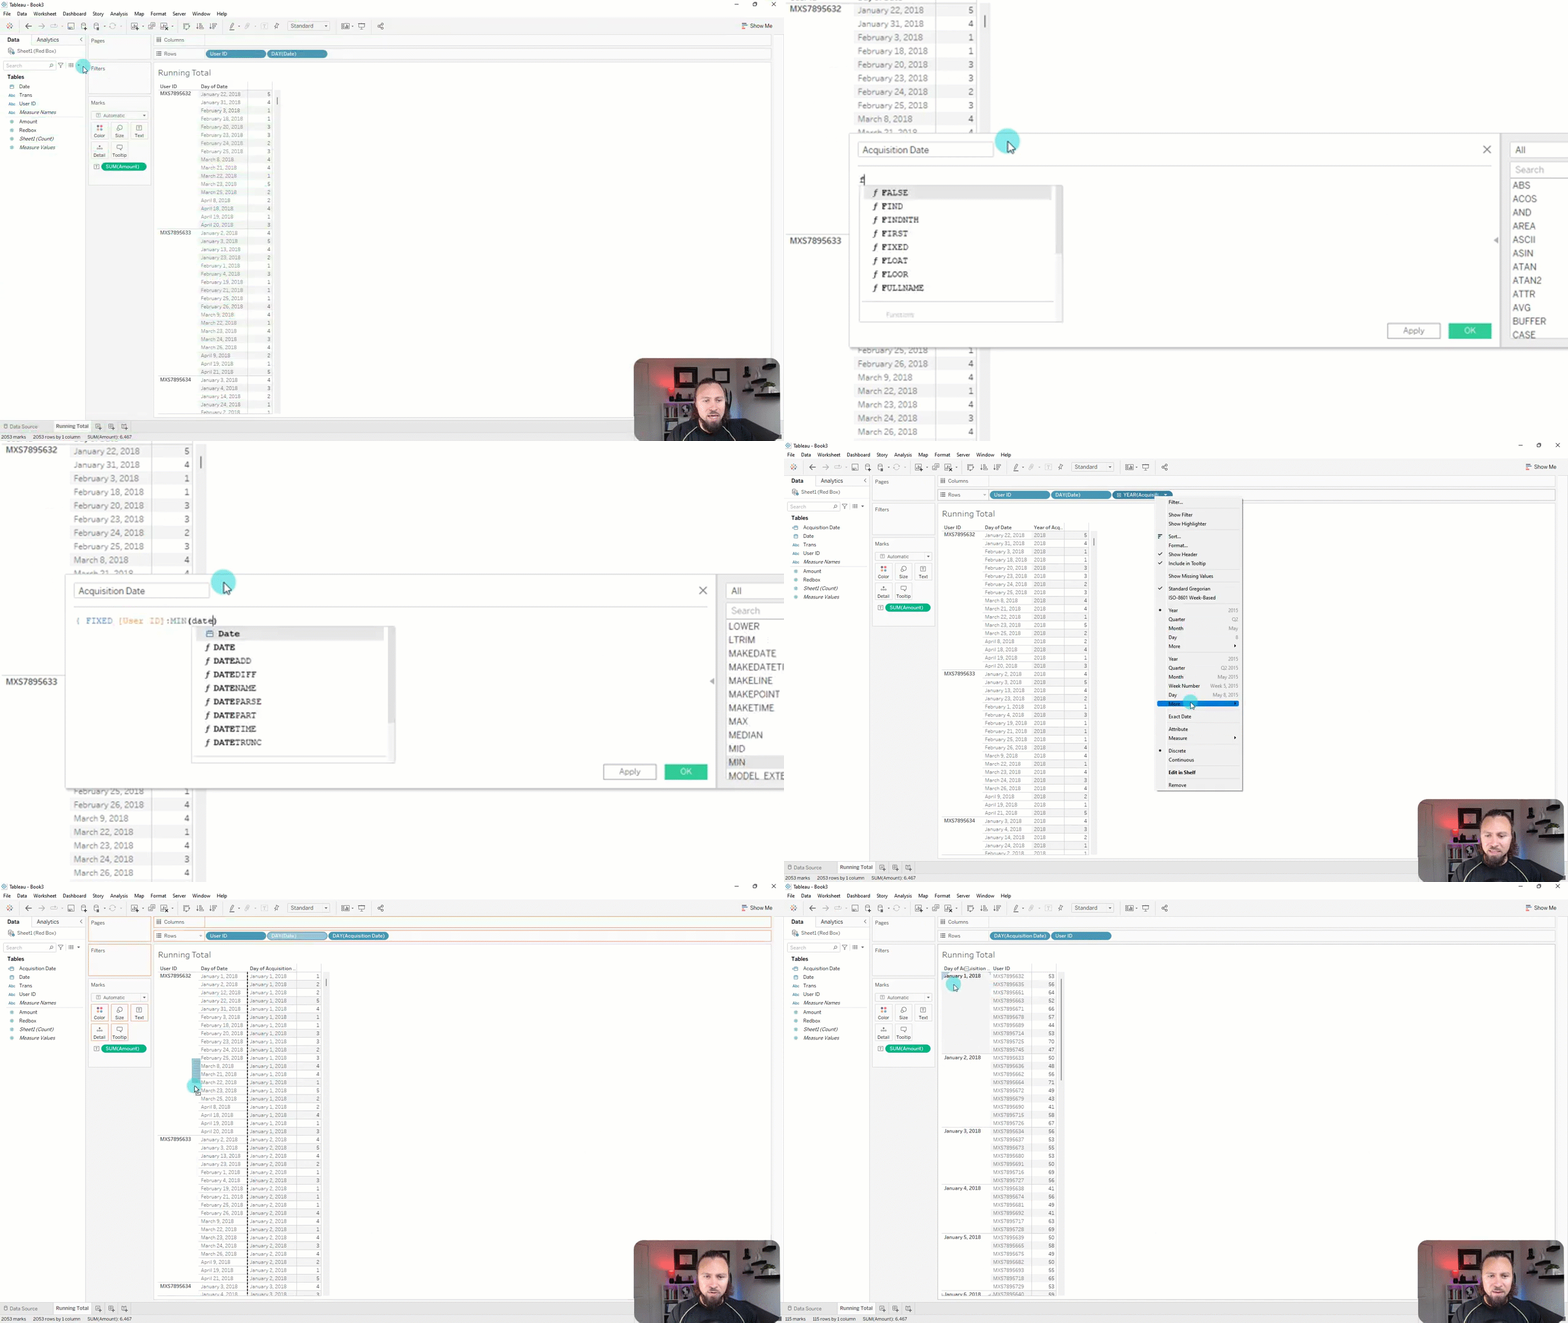
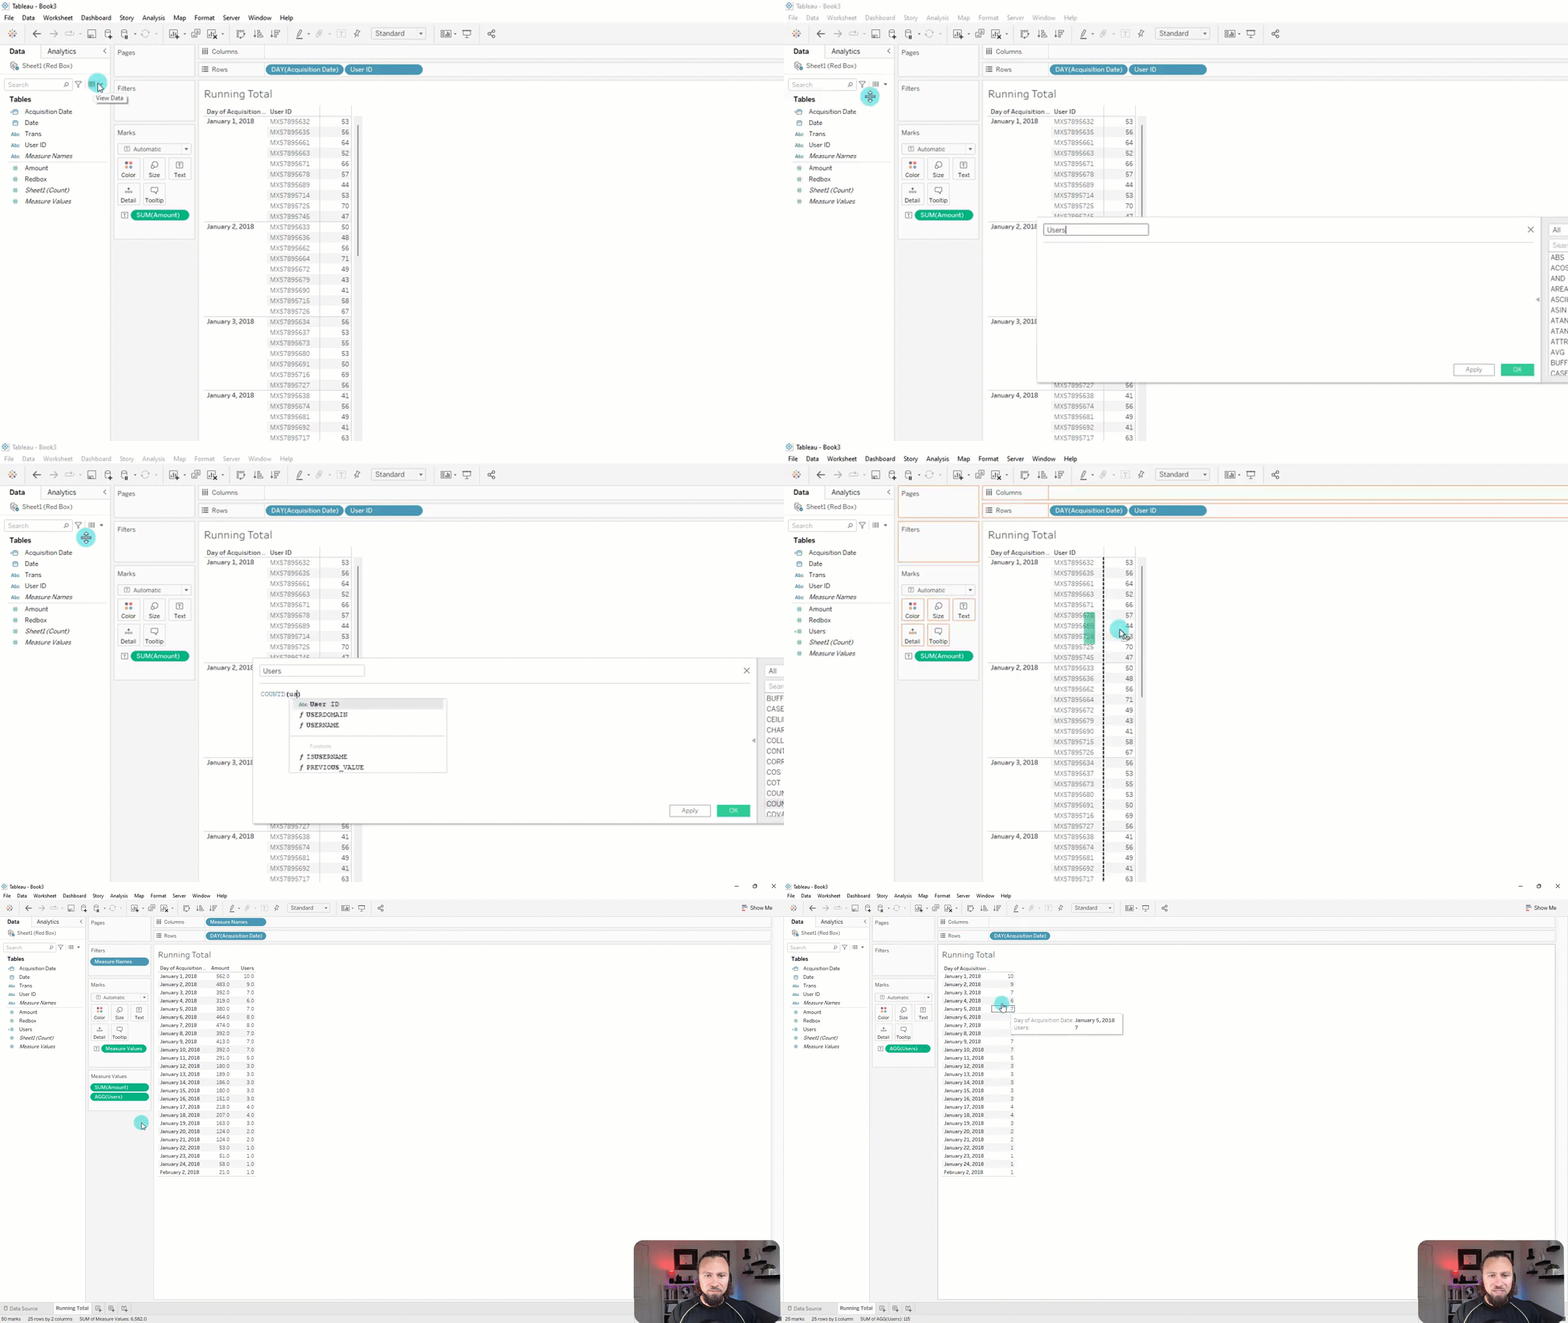
4. Now, we have to create another calculated field called “Users” to which is a distinct count of our users. For this I am using this formula, COUNTD([User ID]). Let’s bring that out to dashboard and get rid of User ID and Amount from the worksheet previously added. The result will look like this, which shows the distinct users that we got on each day.
5. Now we can see the chart with an area chart and count users. The next things is to see the sum over time and we do this with a quick table calculation. To do that right click on Users in rows self and from dropdown select, Quick Table Calculation > Running Total.
Now, instead of just the individual count of users, I have running sum. So it’s now summing each of these. We have successfully completed running total calculation with our sample data. Let’s move to next one.
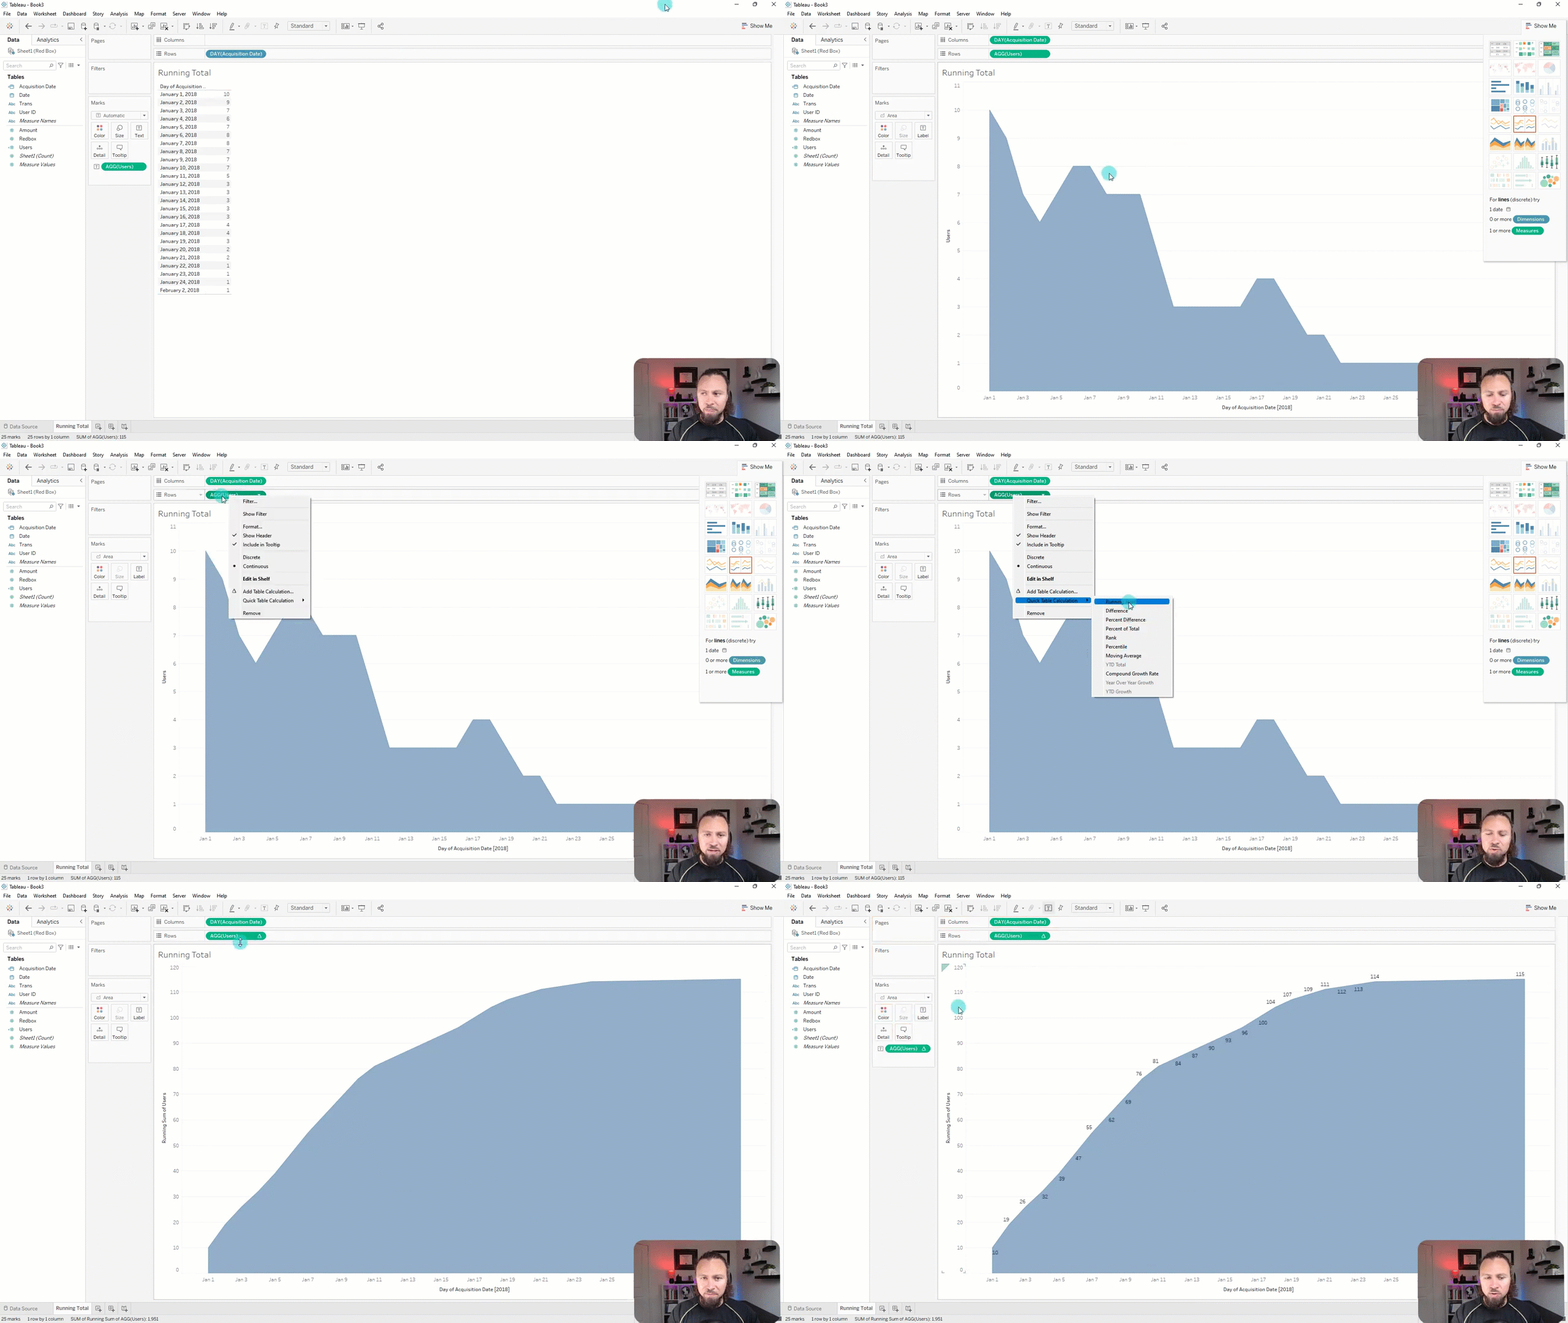
Now, instead of just the individual count of users, I have running sum. So it’s now summing each of these. We have successfully completed running total calculation with our sample data. Let’s move to next one.
Quick Table Calculation Difference:
Now we will see, how we can apply another quick table calculation difference to our sample data. I am going to create new worksheet for it.
- Drag and drop Date to column self and make it Month from default (Year).
- Bring the Amount to worksheet to see amount per month. So, now we can see the dollar amount for each month.
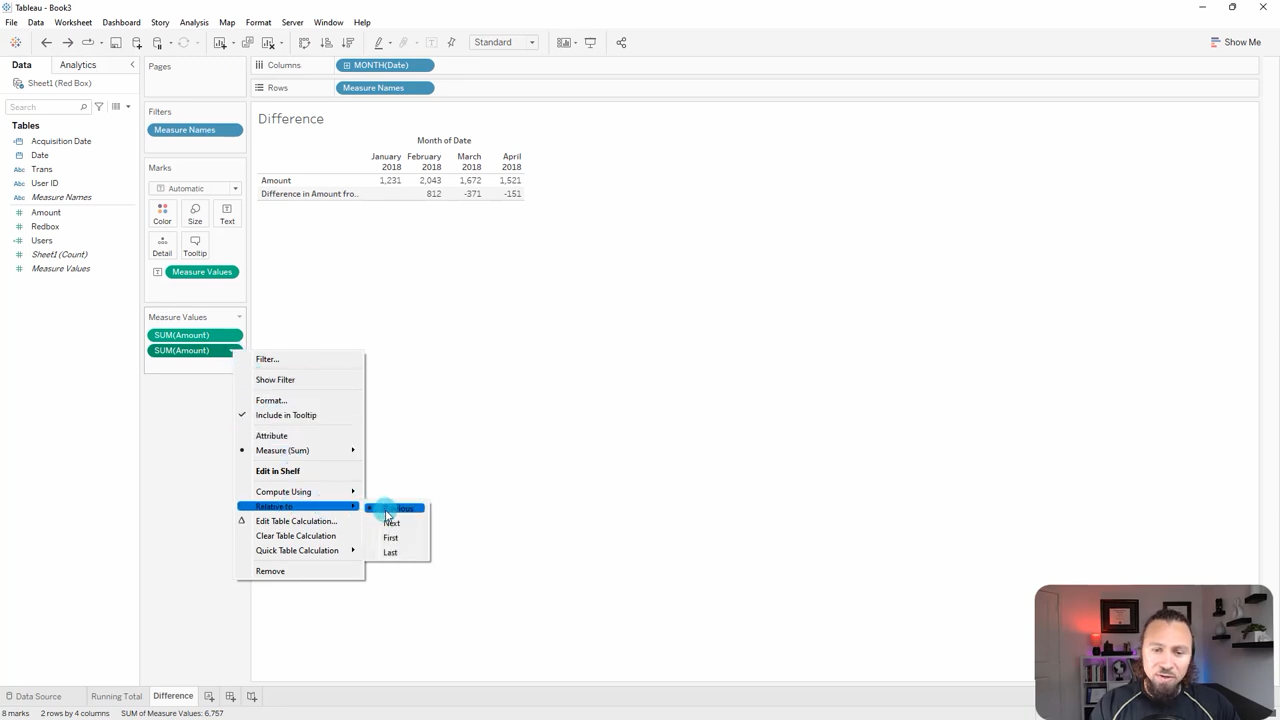
- Now right click on Amount and select Quick Table Calculation > Difference. These will give difference between these months. This is all view dependent so if we switch order it will calculate based on the current field. We can import Amount again to worksheet to verify data.
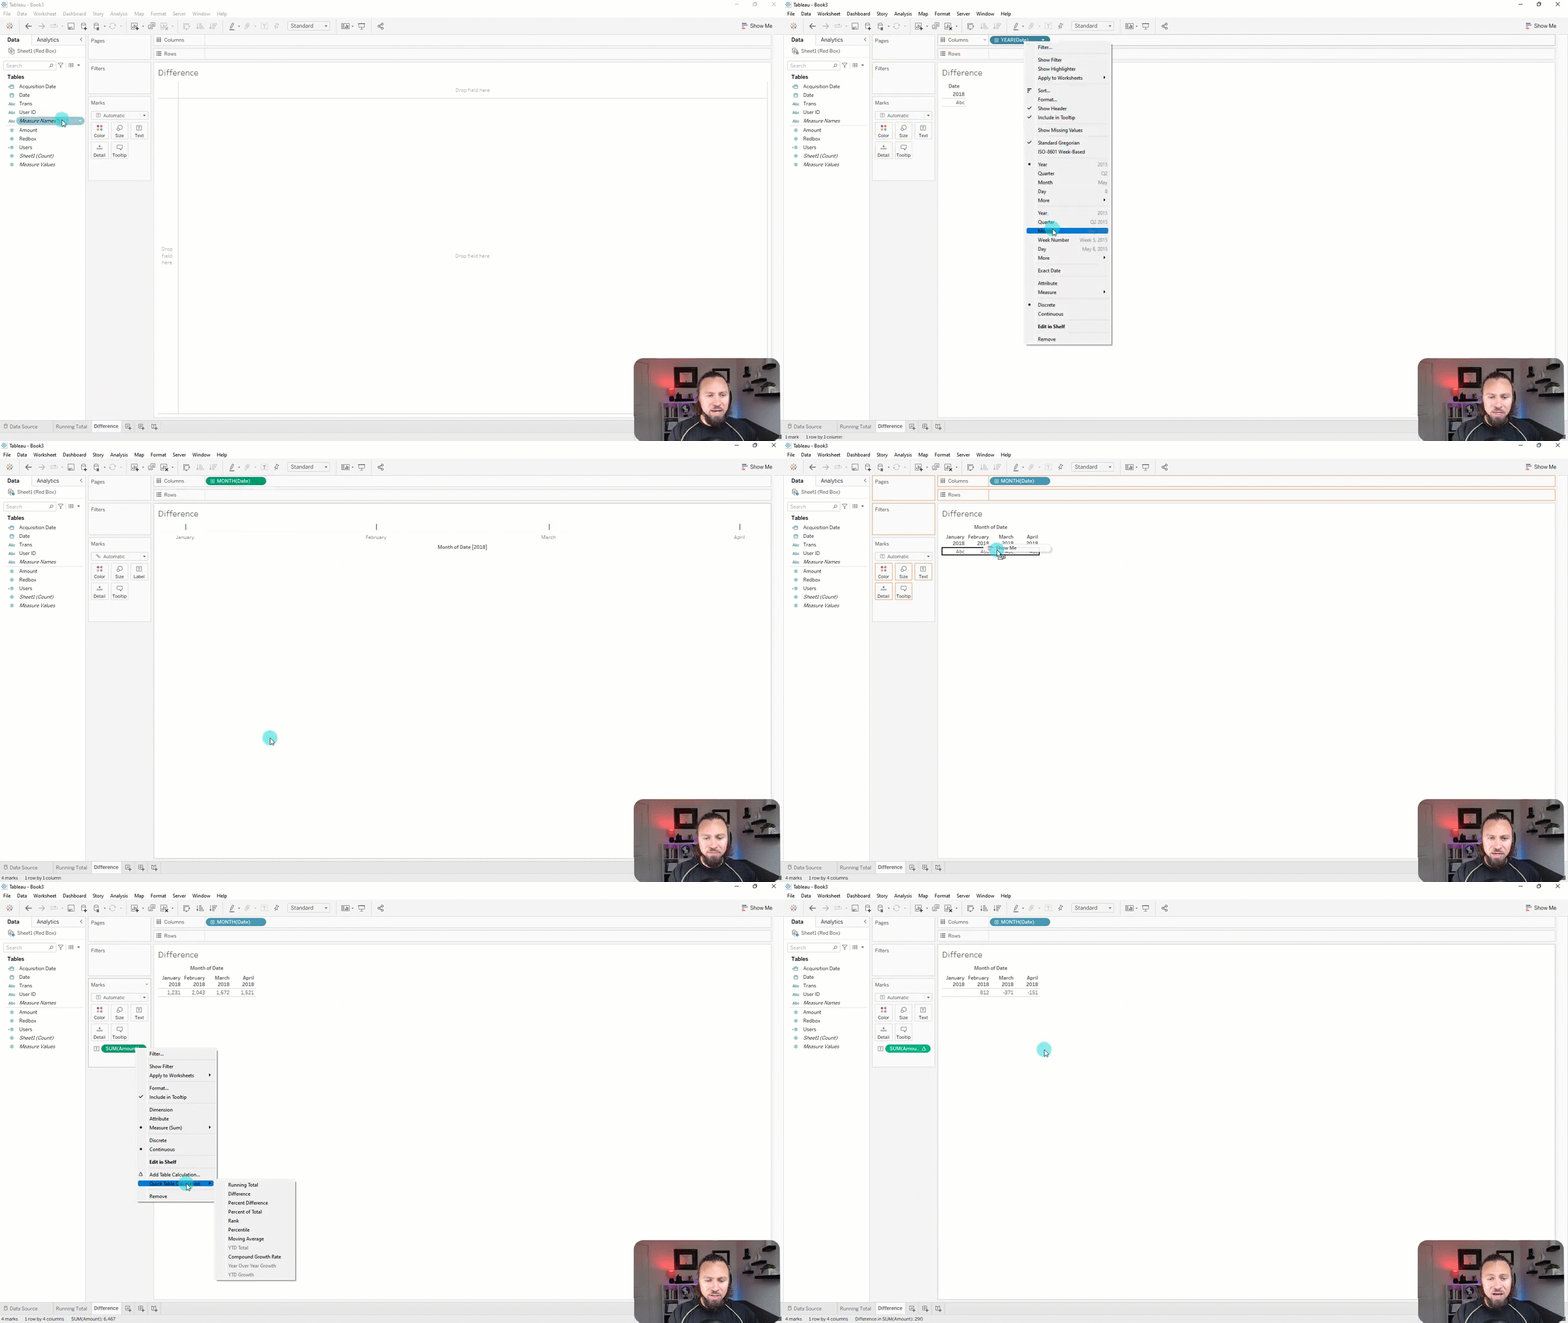
Another option to modify is with relative to. From dropdown select Relative to > and then your desired option (previous, next, first, last). For example, if we select “Previous”, then it will create difference between January and February, February and March etc.
Quick Table Calculation Percent Difference:
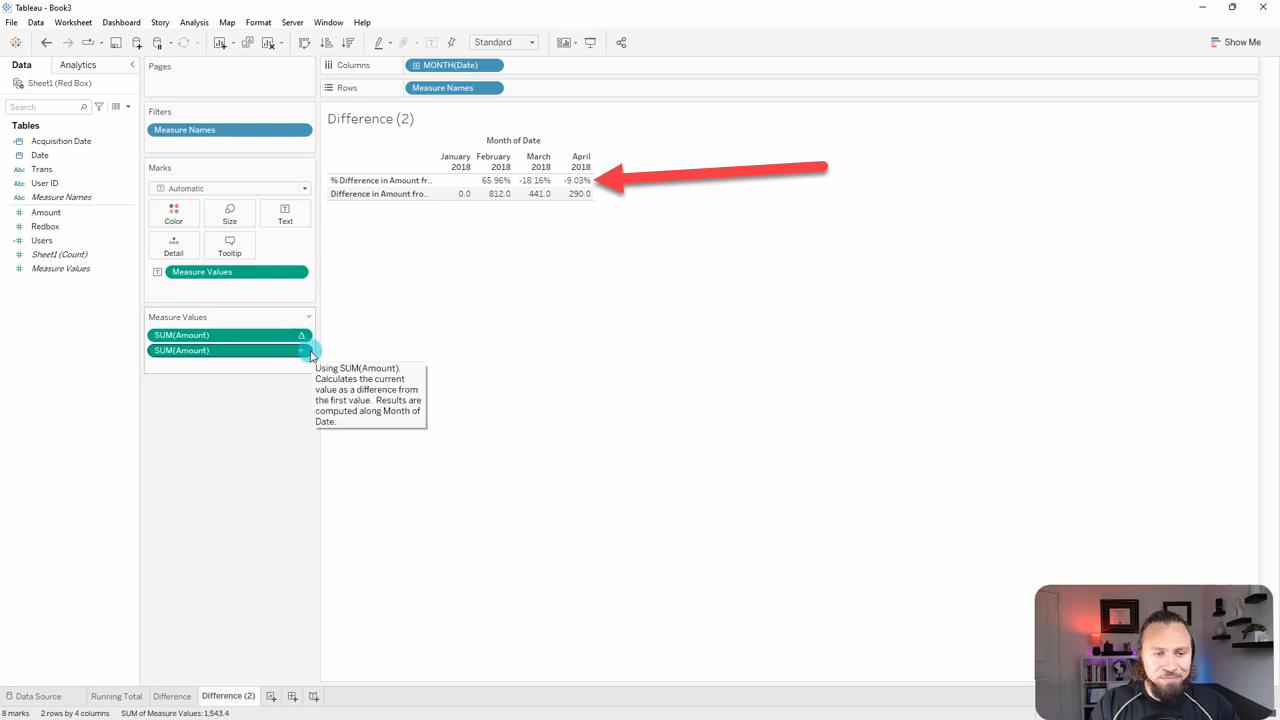
For this example we can duplicate the worksheet that we used in Difference Table Calculation. Right click on the Amount and select Quick Table Calculation > Percent Difference. So, now this is going to give us a percent difference of the previous currently.
Quick Table Calculation Rank:
Let’s open a new worksheet and follow the process.
- Bring User ID to column self.
- Bring Amount to ABC field. So we got our User IDs and how much they all spent.
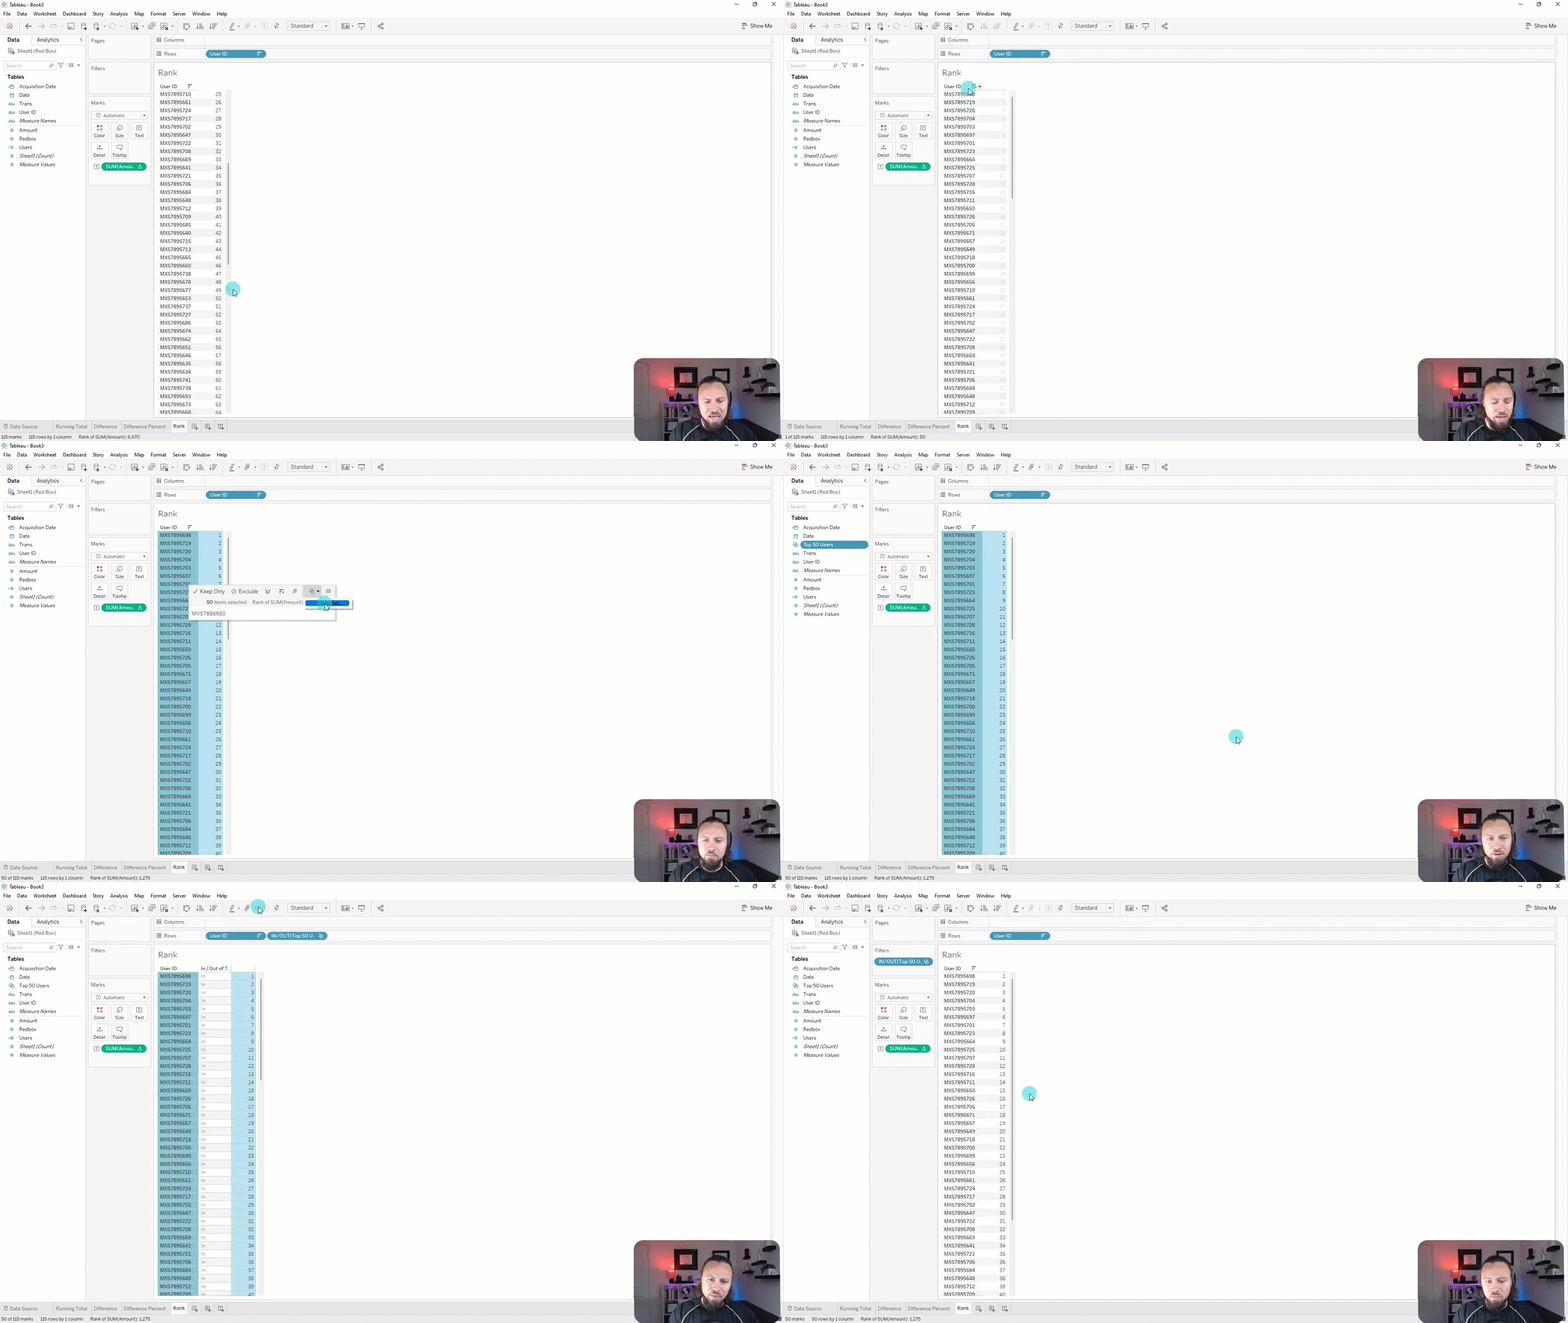
- Now right click on Amount and select Quick Table Calculation > Rank. The result will look like this.
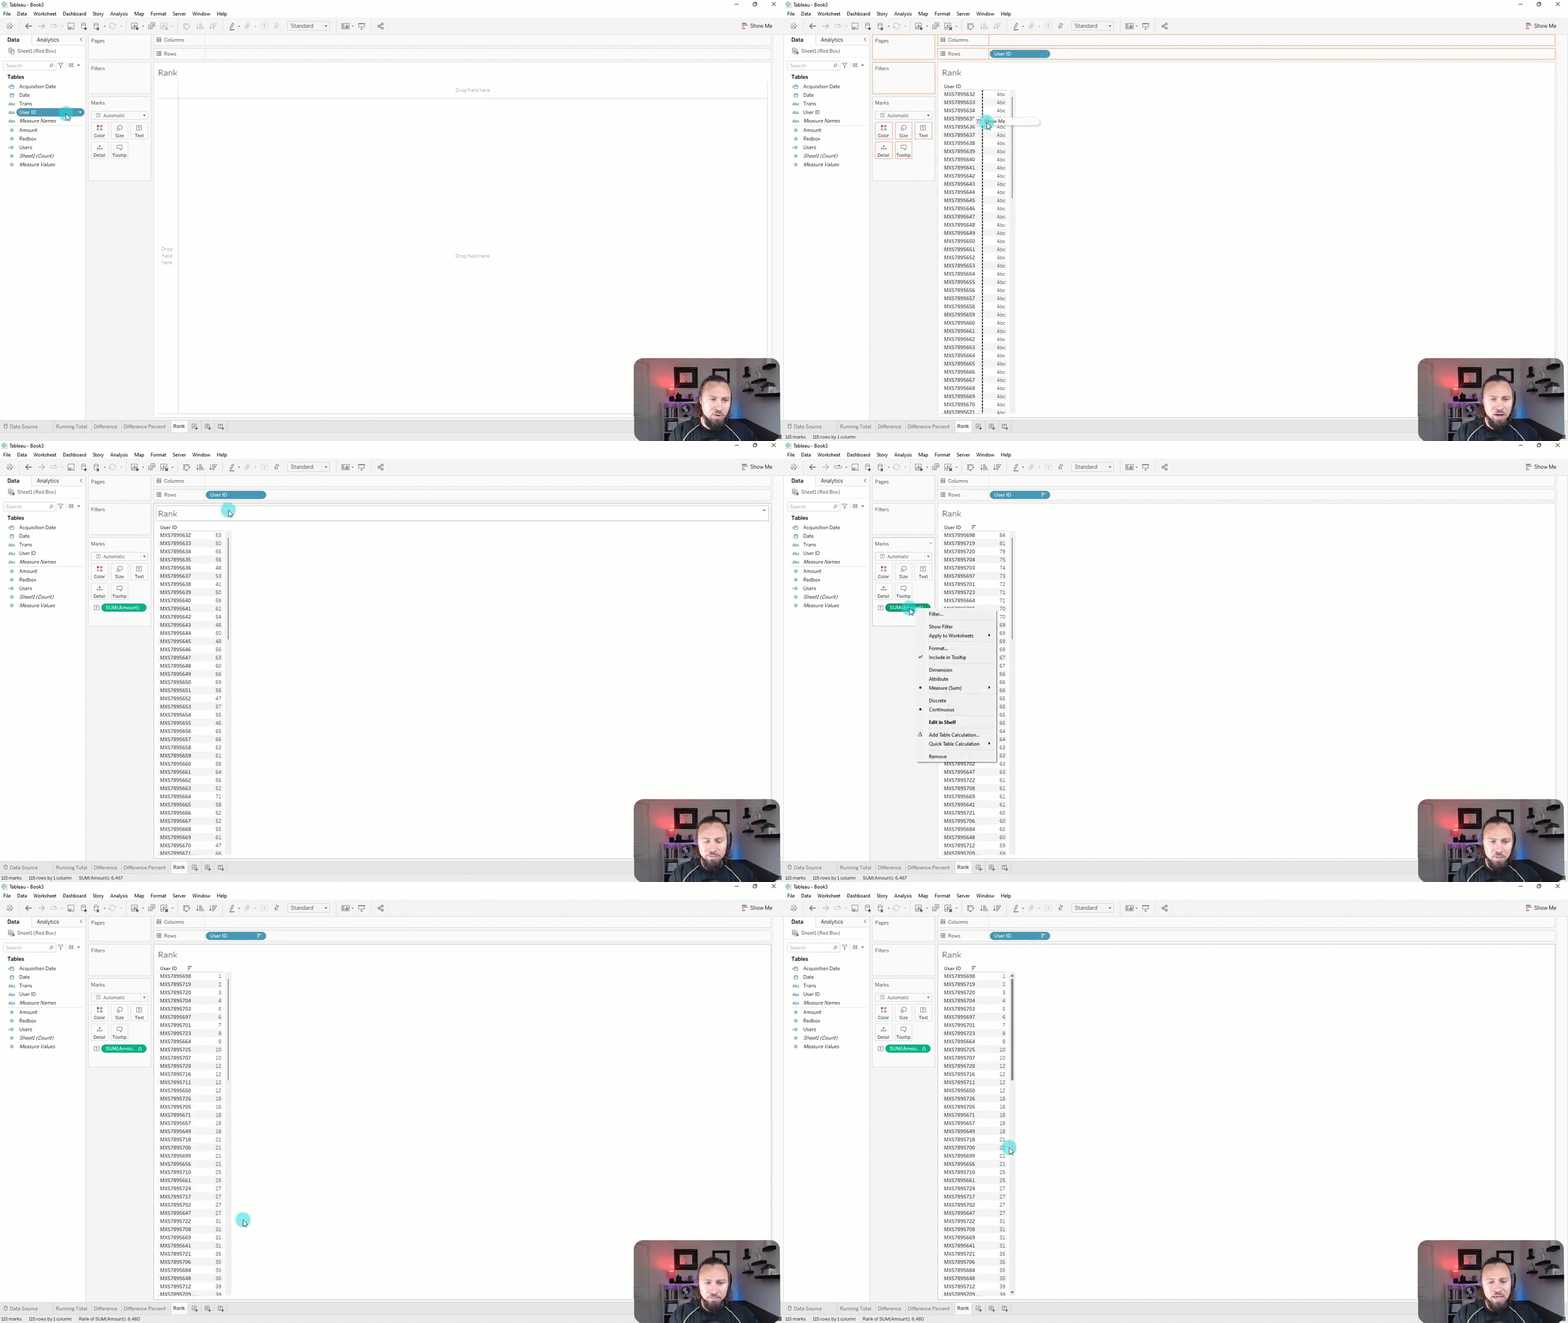
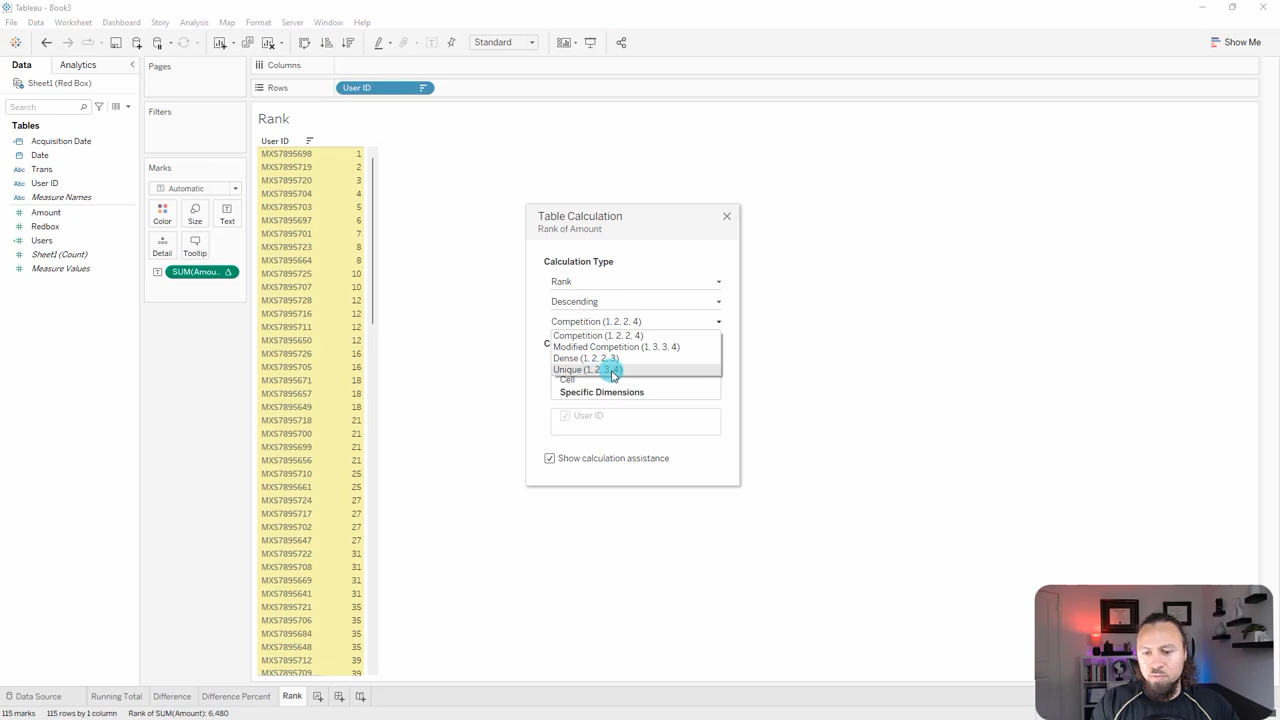
All right. So, we have our ranking here, the 1, 2, 3, 4, etc. Also, you can notice there’s two eights, two tens, four twelves. To solve this we can edit table calculation. If you only want one ranking per user ID, even if they have the same number, select unique option.
Another thing we can do is, we can put User Ids into set. I am going to create set of users who are 50 and under. To do that follow the process.
- Click user ID 50 and go all the way to the first and hold shift all of them. So one through 50 are all highlighted.
- Select create set. This is just going to put all these users in a bucket or in a set. All these user are in my set or out. I’m gonna name the set as “Top 50 Users.
- Now we can bring it in Column self to see which users are in or out.
Quick Table Calculation Percent of Total:
Another popular quick table calculation is percent of total, which I use regularly.
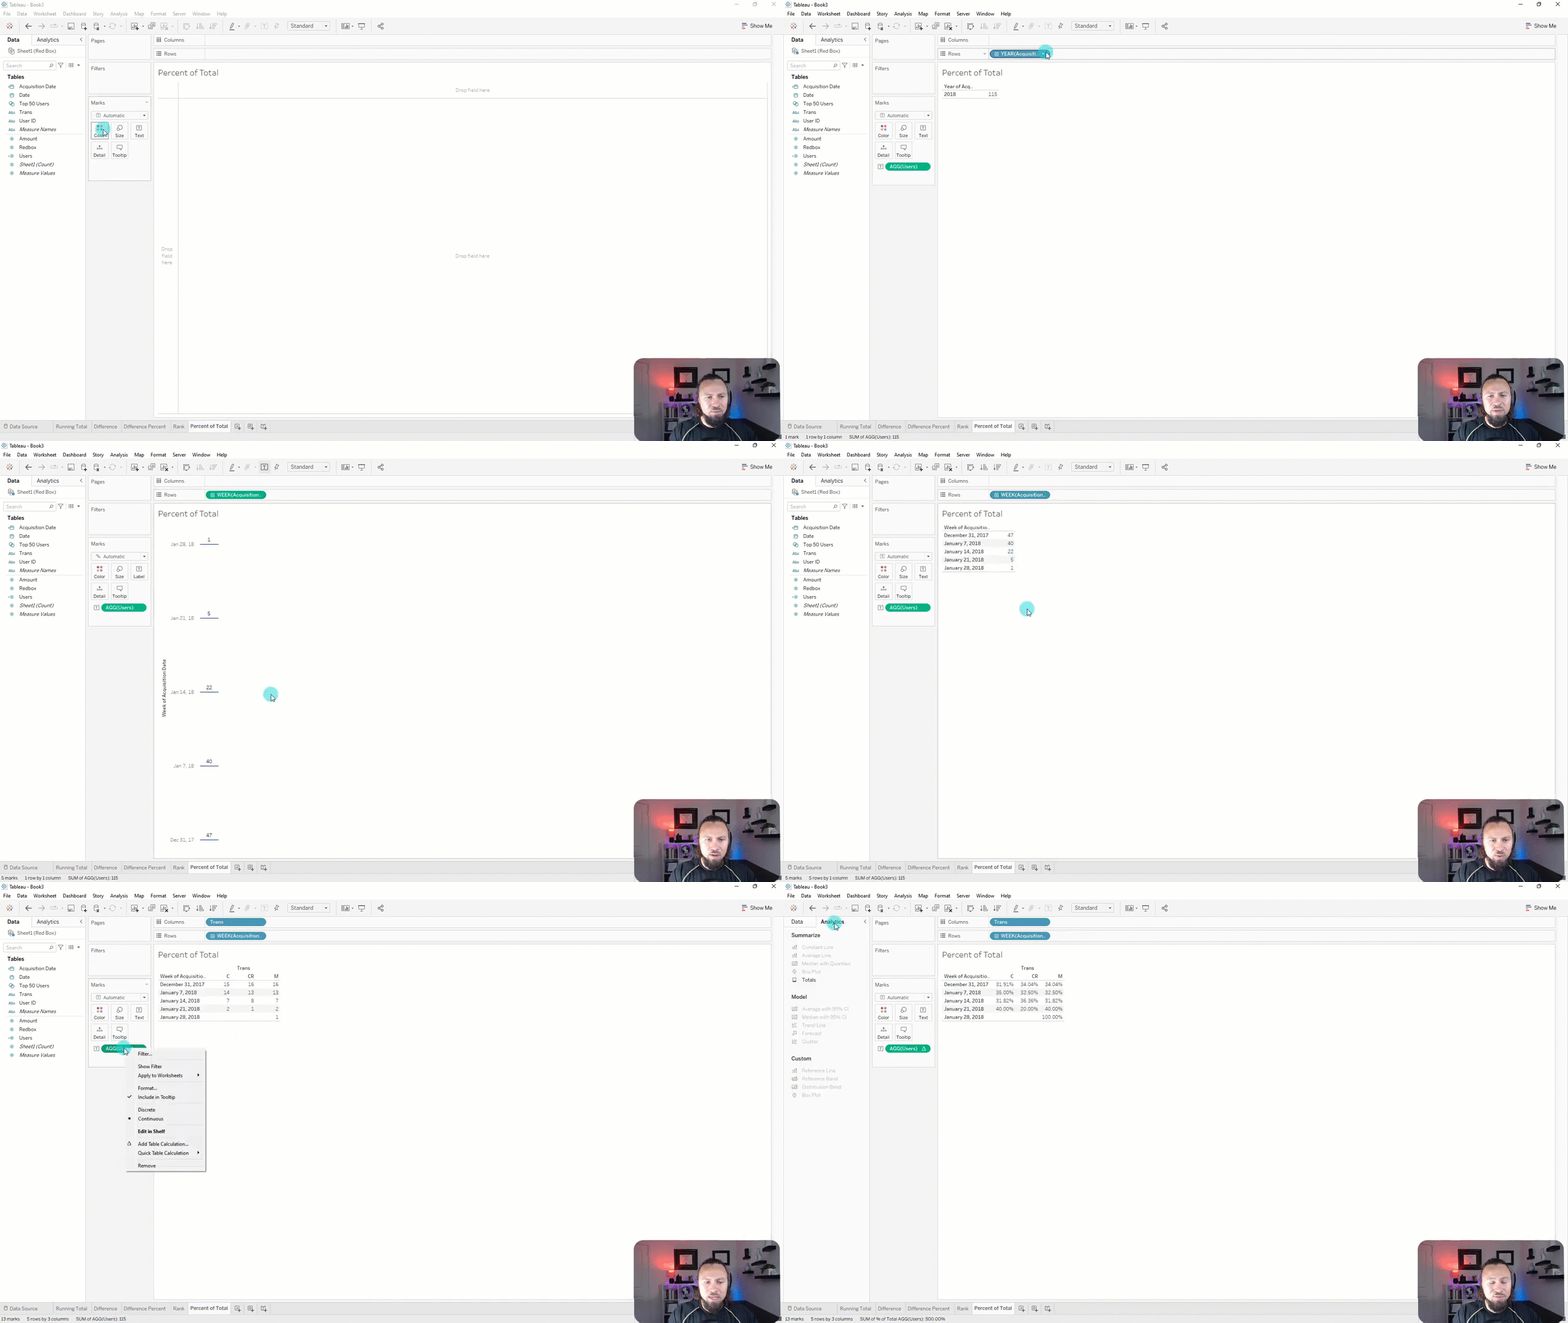
- Bring Acquisition Date in Rows self and make Acquisition Date from Year to Weak Number.
- Bring users in ABC field.
- Now bring Trans (Transaction type) to column self.
- Right click on Users and select Quick Table Calculation > Percent of Total.
These are the mostly used quick table calculation that we use regularly. If you have any question let us know in comment section.


